

















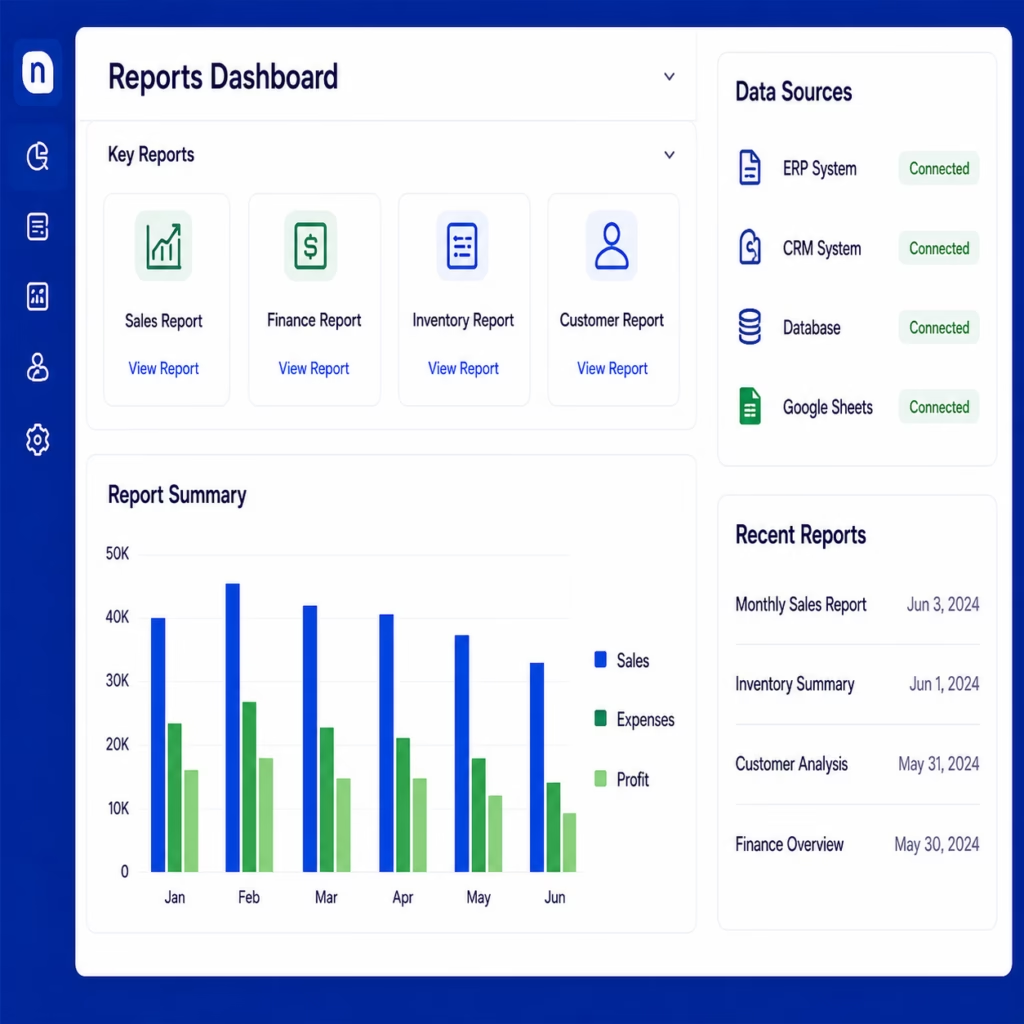
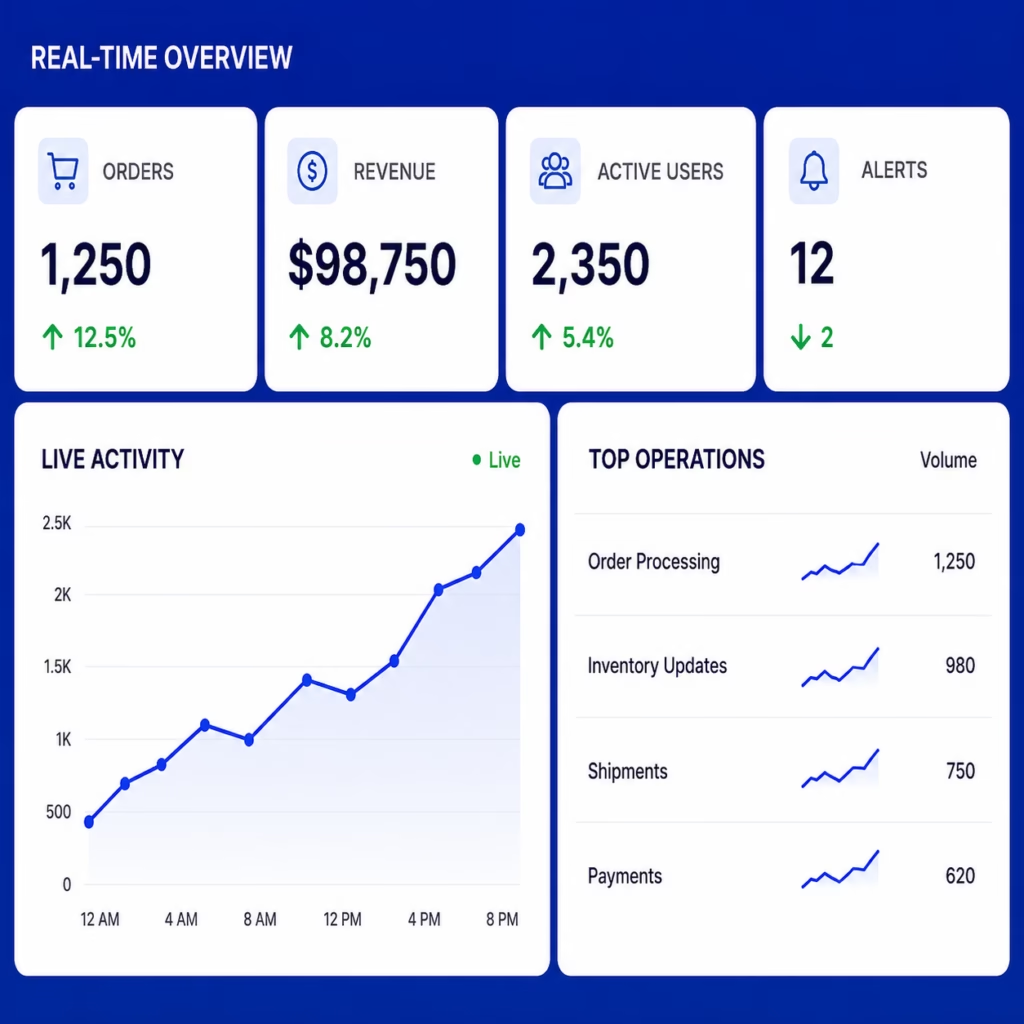

Turn Data Into Clear Business Insights
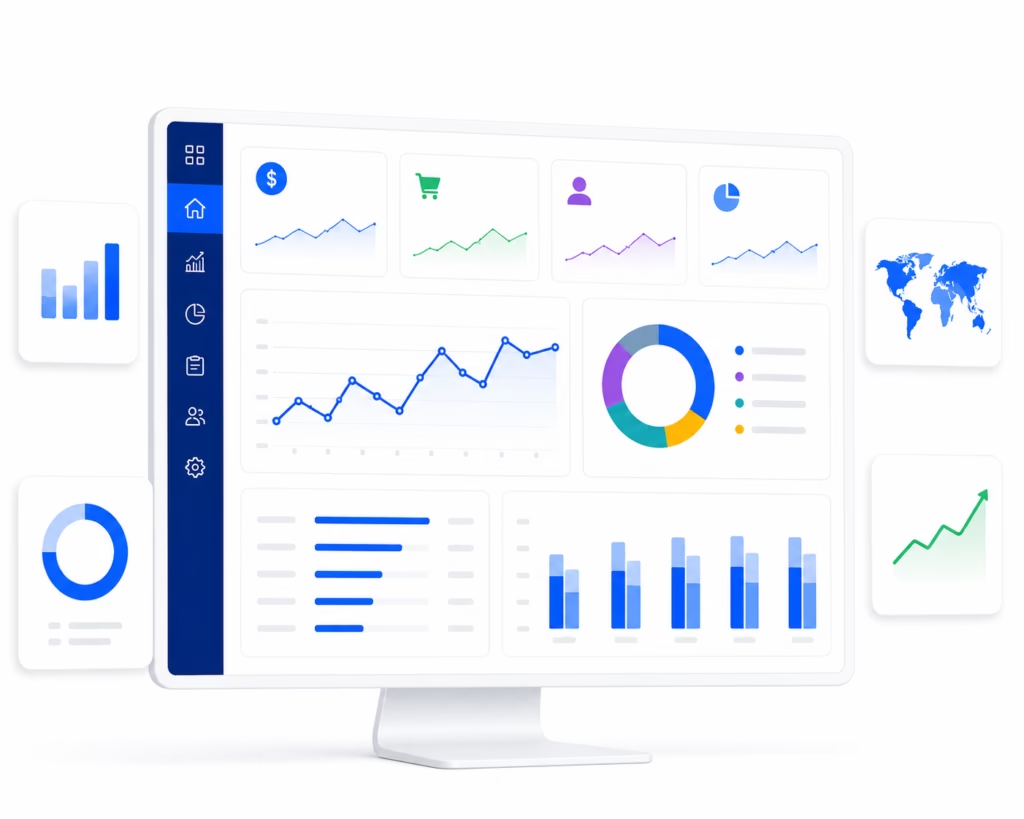
Bring your business data together through interactive dashboards and advanced analytics that help teams understand performance, identify trends, and make informed decisions.
Proven Track
Record
Customer
Satisfaction
We Have
Completed
Real-Time
Data Visibility
Business Insights
24/7
Dashboard Access
Data-Driven Reporting
See What Your Data Is Telling You
Bring information from across your business into clear dashboards and analytics that make performance, trends, and opportunities easier to understand.
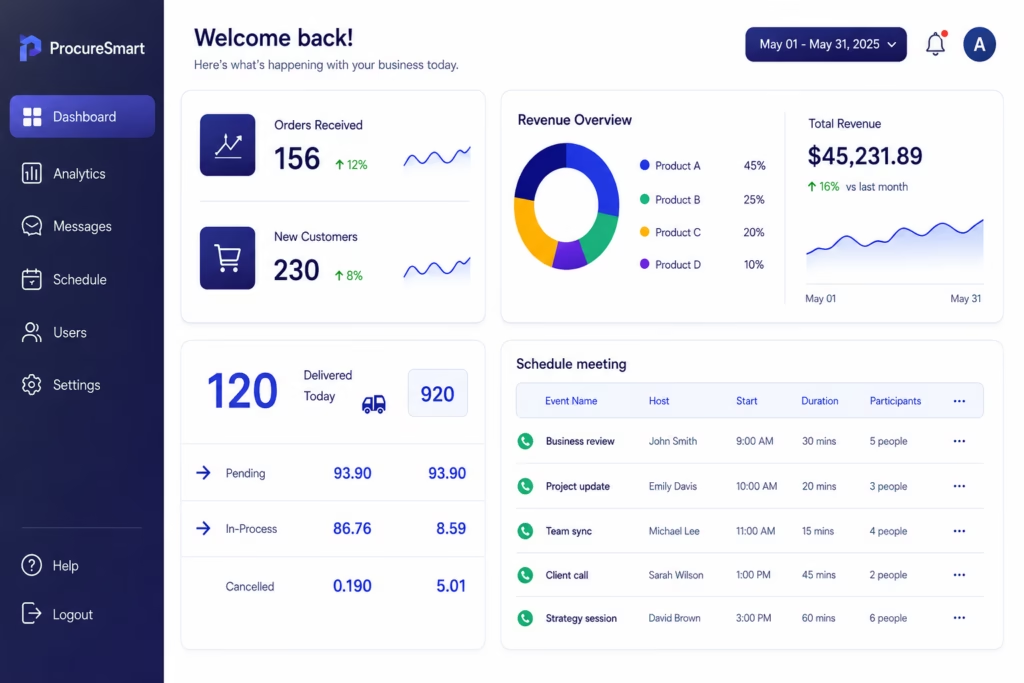
Business Intelligence & Dashboards
Create interactive dashboards that bring key business metrics together in one place.
- Interactive Dashboards
- KPI Monitoring
- Data Visualization
- Management Dashboards
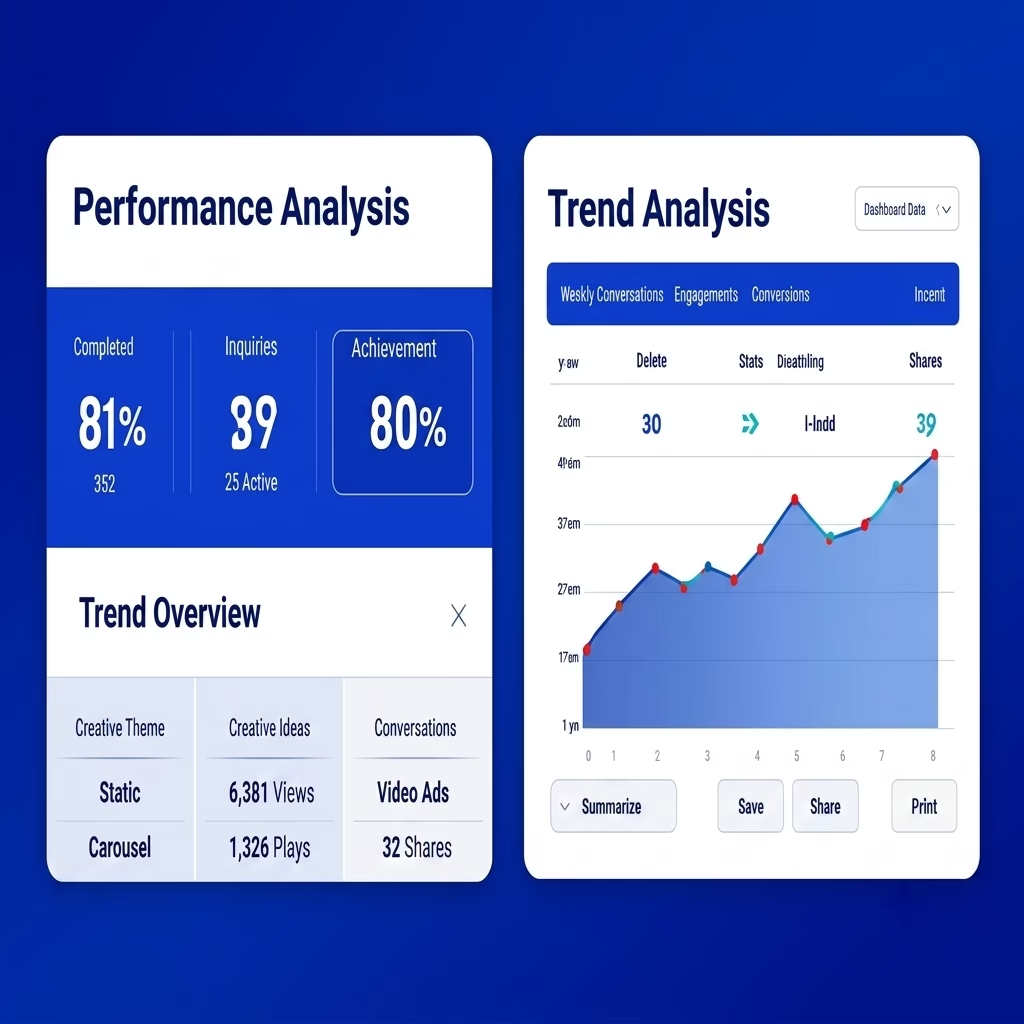
Advanced Data Analytics
Analyze business data in greater depth to identify patterns, trends, and opportunities.
- Trend Analysis
- Performance Analysis
- Statistical Analysis
- Data Exploration
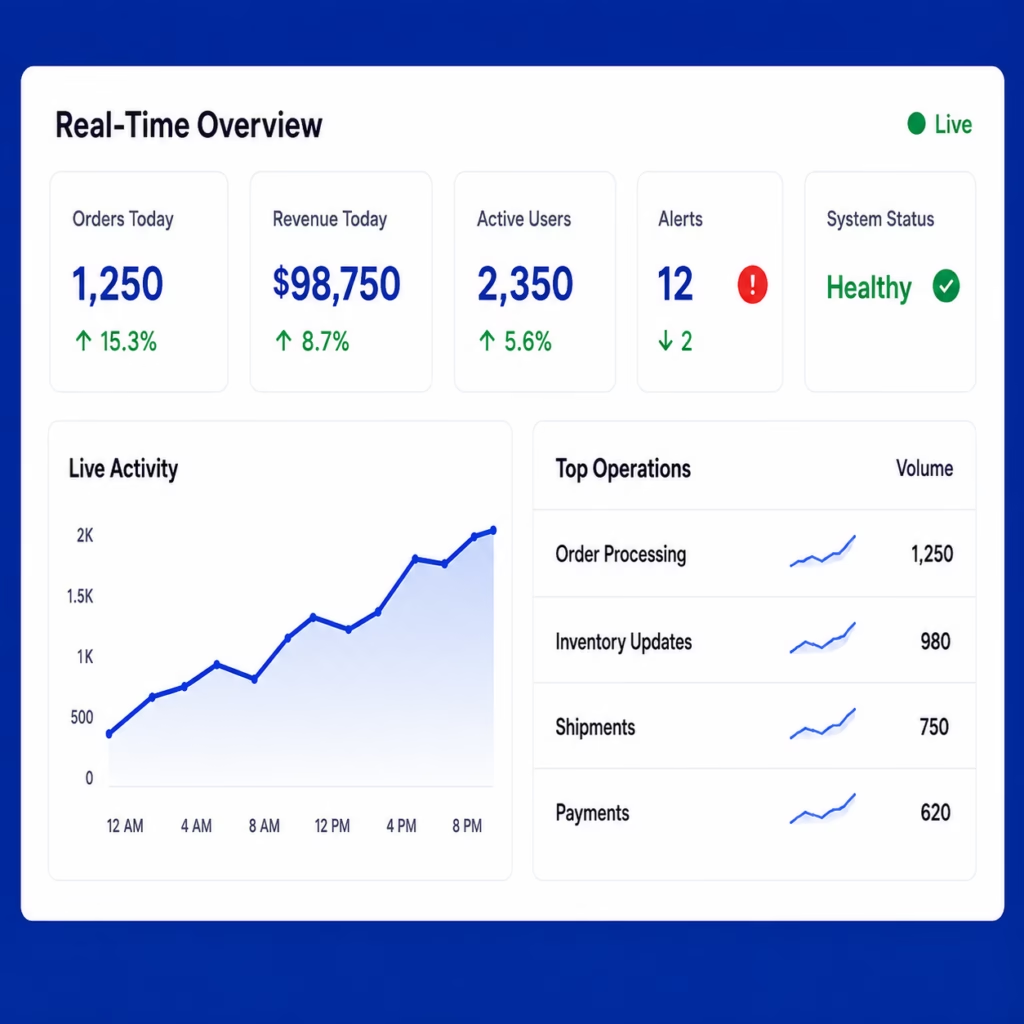
Real-Time Analytics
Monitor business activity and access up-to-date information through connected data sources.
- Real-Time Dashboards
- Live Data Monitoring
- Operational Analytics
- Alerts & Notifications
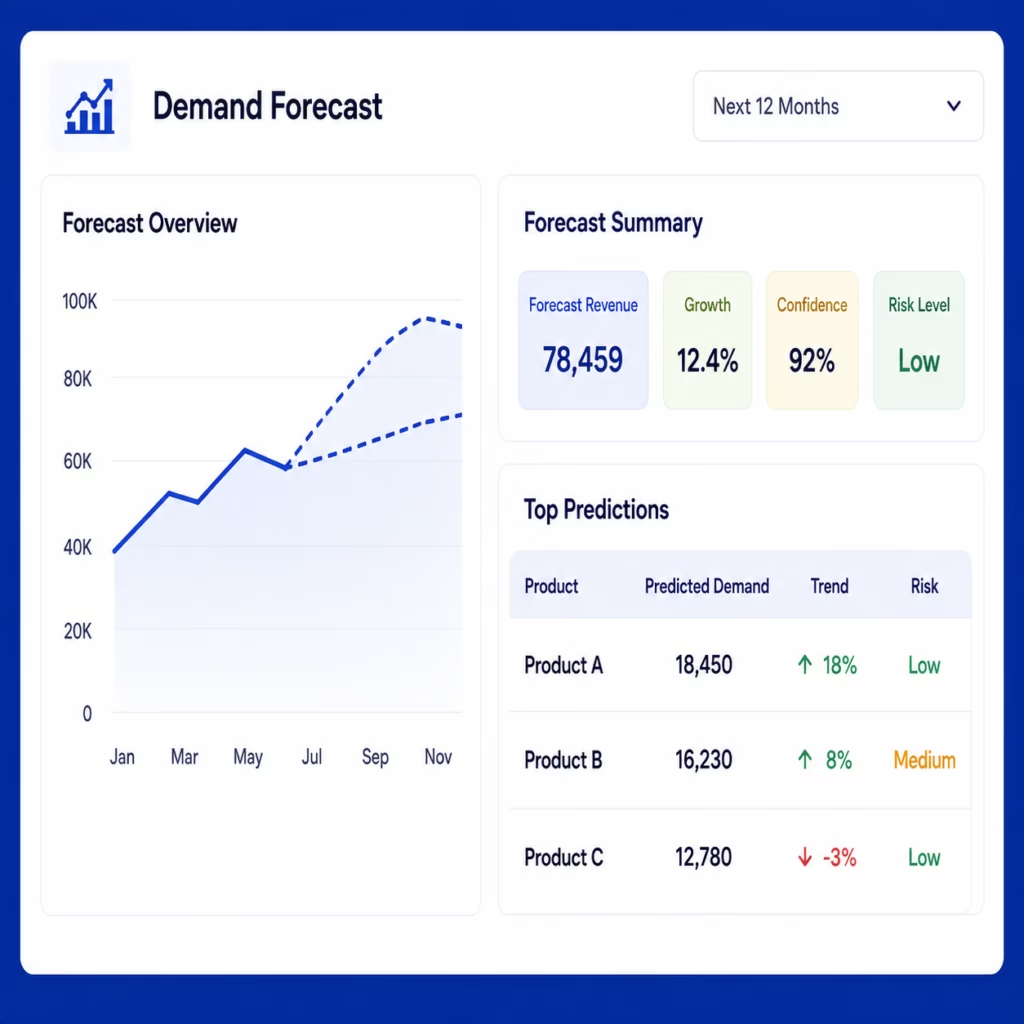
Predictive Analytics
Use historical and current data to identify trends and support better planning and forecasting.
- Demand Forecasting
- Sales Forecasting
- Trend Prediction
- Risk Analysis
Data Integration & Reporting
Bring data from ERP, CRM, databases, spreadsheets, and other systems into a unified reporting environment.
- Data Integration
- Data Consolidation
- Automated Reporting
- Custom Reports
Executive & Management Analytics
Give decision-makers a clear view of business performance through focused reports and visual analytics.
- Executive Dashboards
- Financial Analytics
- Operational Reports
- Performance Scorecards
Why Choose Our Dashboard
Analytics Solutions?
We combine clear dashboards and advanced analytics to help teams understand performance and make faster, informed decisions.
Data From Every Source
Bring data from ERP, CRM, databases, spreadsheets, and other business systems into a single analytics environment.
Dashboards Built Around Your KPIs
Track the metrics that matter to your business through dashboards designed around your teams, processes, and reporting needs.
Real-Time Business Visibility
Get up-to-date information on business performance without relying on manual reports or disconnected data.
Advanced Analytics
Go beyond basic reporting to identify trends, patterns, performance gaps, and opportunities hidden within your data.
Clear, Actionable Insights
Turn complex data into easy-to-understand visualizations that help teams quickly understand what is happening and take action.
Scalable Analytics
Start with the dashboards you need today and expand your analytics capabilities as your data and business requirements grow.
Connected Systems. Unified Procurement.
Connect ProcureSmart with your ERP, finance, inventory, and other enterprise systems to keep supplier evaluation data synchronized and accessible across your organization.
See More Case Studies

A Digital Platform Transforming Gold Scheme Management /(or) A Scalable Digital Platform for Modern Gold Scheme Management
Bhima is a trusted brand offering structured gold investment schemes that help customers save and invest systematically. To modernize its operations and enhance customer experience, Bhima required a secure, transparent, and scalable digital platform that could handle scheme management, payments, and customer engagement efficiently.
Choosing the Right CRM for Your Business: A Buyer’s Guide
Choosing a CRM today is no longer just about storing customer details. Businesses now expect customer management software to improve retention, support sales automation, and give teams a complete view of every customer interaction. With dozens of tools in the market, selecting the right CRM can feel…


Abad Fisheries-Digital Transformation of a Global Seafood Leader
Abad Fisheries is a dominant force in the seafood processing industry, operating 11 certified factories with a combined output of 300+ MT per day and 4 cold storage units exceeding 15,000 MT in capacity. Their reach spans global markets, and their reputation for quality and scale is unmatched.
Frequently Asked Question
Most frequent questions and answers
Dashboard and analytics solutions turn business data into visual reports and insights, helping teams monitor performance, identify trends, and make informed decisions.
Yes. Dashboards can connect with ERP, CRM, databases, spreadsheets, and other business applications to bring relevant data into one place.
Yes. Dashboards can be designed around specific KPIs, reporting requirements, and business needs of different teams and departments.
Yes. Where the underlying data source supports it, dashboards can provide real-time or regularly refreshed information for up-to-date monitoring.
Advanced data analytics goes beyond basic reporting to identify patterns, trends, relationships, and other insights within business data.
Yes. We can create focused dashboards that provide management with a clear view of key business and operational metrics.
Yes. The analytics environment can be deployed based on your organization’s infrastructure, security, and data requirements.
Turn Your Data Into Better Decisions
Bring your business data together through clear dashboards and advanced analytics that help teams monitor performance, identify trends, and make informed decisions.